Electric Capital 2024 Developer Report: The industry is growing at an average annual rate of 39%; Asia becomes the continent with the highest proportion of developers
Original author: Maria, Electric Capital
Original translation: 1912212.eth, Foresight News
Since its inception, 829 people have participated in the production of the sixth annual ElectricCapital Developer Report. We analyzed a record 902 million code commits, covering 1.7 million code bases.
How does the crypto industry data perform in 2024?
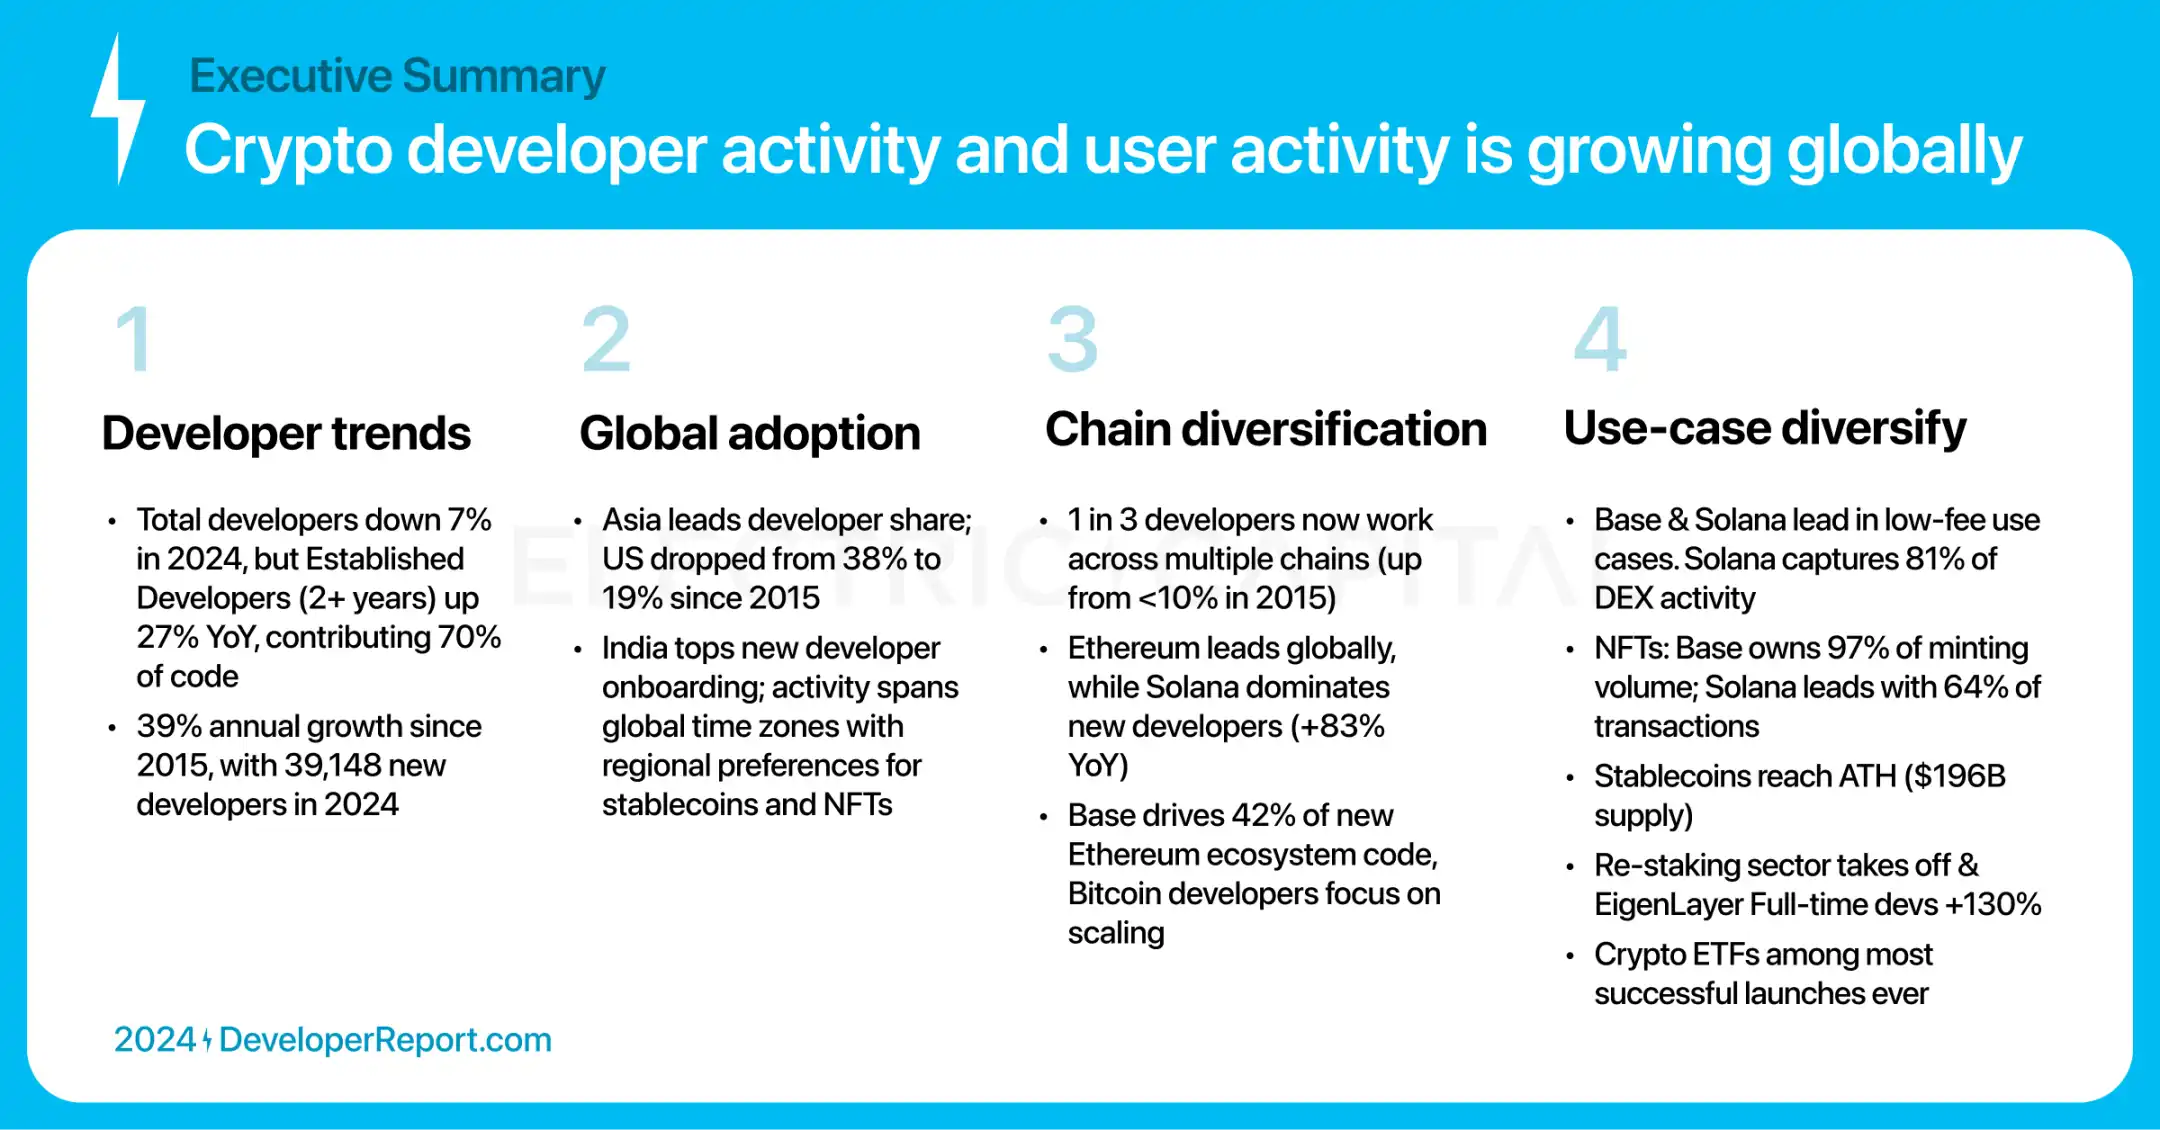
Key points summary:
· The crypto industry is global, and developer momentum has shifted from North America to other regions.
· Developers and use cases are diversifying across different ecosystems.
· Applications cover all time zones, indicating widespread adoption around the world.
We underestimate the number of developers in crypto because our count focuses only on open source development activity.
Our methodology includes:
· Merge developer profiles into a single, standard identity.
· Identify and exclude bot accounts.
· Remove codebases that do not reflect development activity, such as data lists.
Since Ethereum launched in 2015, the crypto industry has grown at an average annual rate of 39%. In 2015, there were about 1,000 monthly active developers. Today: 23,613 monthly active developers.

The number of monthly active developers has slightly decreased by 7% over the past year.

However, the number of developers who have been working in crypto for more than two years has grown by 27%.

These experienced developers drive the industry forward as they contribute 70% of code commits.

How has the crypto industry changed since 2015? Let’s take a look at the global diversity of crypto developers.
The center of gravity of developer distribution shifted from the United States and Europe at 82% to the rest of the world.

Asia is now the continent with the highest developer share, with one in three crypto developers living in Asia. Europe is second. North America has dropped from first to third since 2015.
We can identify the top ecosystems on these continents by developer share.
Ethereum is the top ecosystem in every major continent by developer share.
· Solana is second.
· Polygon is third in Asia and South America.
· Polkadot is third in Europe.
· Base is third in North America.
· dfinity is third in Africa.

The United States, India, the United Kingdom, China, and Canada account for the largest share of global crypto developers.

The United States remains the country with the highest share of crypto developers, but has continued to decline since 2015. India rose from 10th to second place.
The top three ecosystem developer share by country:
· Ethereum ranks first in the United States, the United Kingdom, China, and Canada, and ranks second in India.
· Solana ranks first in India and second everywhere else.
· Base ranks third in the United States and India.
· Polygon ranks third in the United Kingdom.
· NEAR Protocol ranks third in Canada.
· Polkadot ranks third in China.

India saw the highest number of new crypto developers in 2024. 17% of new crypto developers are from India.

Let’s focus on new developers – a total of 39,148 new developers explored crypto in 2024. We can break these new developers down by ecosystem.
Solana became the ecosystem with the highest number of new monthly developers joining in July 2024.

Overall New Developers in 2024:
Solana is the ecosystem with the most new developers, ranking first.
Ethereum is second. dfinity, Aptos, Base, Bitcoin, SuiNetwork, NEAR Protocol, Polkadot, Polygon, and Starknet all have more than 1,000 new developers.

arbitrum, BNBCHAIN, Optimism, StellarOrg, and ton_blockchain all have more than 500 new developers.

Who is growing the fastest in total number of developers? The total number of developers reflects the interest of new developers and hackathon participants.
Based on data from Q3 2023 and Q4 2024, the top 10 fastest growing ecosystems by total developer count are:

Who is growing fastest in full-time developers? Full-time developers commit code more than 10 days per month, so they contribute a steady amount of work to the ecosystem.
Based on data from Q3 2023 and Q4 2024, the top 10 fastest growing ecosystems by full-time developers are:

Many developers are active on multiple chains - One in three crypto developers now works on multiple chains, and this trend is growing. Monthly active multichain developers increased from less than 10% in 2015 to 34% in 2024.

Chains with the most multichain developers share developer resources with Ethereum.

EVM chains share the most developers and have significant network effects: 74% of multichain developers work on EVM chains.

The percentage of EVM cross-chain deployers has grown 4x since 2021.

Base is the most popular chain for EVM multi-chain deployers in 2024, but Base deployers tend to stay on the Base chain.


Since deployers publish code to multiple chains, where is most of the original code written?
Before 2020, almost all original on-chain code logic on the EVM was on Ethereum.

Now, no EVM chain has more than 30% of code innovation.

Base now accounts for 25% of original on-chain code logic on all EVM chains, the most of any major EVM chain.

This is how the Ethereum ecosystem stays ahead of the curve in code innovation — through L2 chains. 65% of innovation happens on mainnet and ETH L2 chains.

The Ethereum ecosystem demonstrates strong network effects through dominance among EVM and multi-chain developers. How is the ecosystem performing?
Ethereum’s monthly active developers are 6,244, down 17% year-over-year.


Most of the losses came from developers who joined after 2021. Among developers who have been working on Ethereum for more than 2 years, there has been a 21% increase.

More than half of Ethereum developers are now working on the Ethereum L2 chain, compared to 25% in 2022.

The Ethereum L2 chain has experienced significant growth in developers over the past 4 years. The total number of monthly active developers on the Ethereum L2 chain is 3,592, an average annual increase of 67% since the launch of Arbitrum in 2021.
Base is the largest Ethereum L2 chain.

arbitrum, Starknet, Optimism all have over 2,000 developers in 2024.

Bitcoin has 1,200 monthly active developers in 2024, which remains stable.

The number of experienced Bitcoin developers (those who have been working on Bitcoin for more than 2 years) has been growing steadily. Currently, there are 672 experienced Bitcoin developers active per month, a new high.

42% of Bitcoin developers — almost half — are working on Bitcoin scaling solutions.

Zero-knowledge proofs (ZK) is a developer-centric, research-born field. How is it growing?
Over 2,000 monthly active developers work in the ZK ecosystem, of which 823 are full-time developers committing code more than 10 days per month.


On-chain deployments of zero-knowledge proofs (ZK) have also grown from 40 in 2020 to 639 in 2024.

Zero-knowledge proofs (ZK) are also growing from 40 on-chain deployments in 2020 to 639 in 2024.


Zero-knowledge proofs (ZK) are also growing from 40 on-chain deployments in 2020 to 639 on-chain deployments in 2024.
While the numbers are still relatively flat, they show definite growth. The number of deployers has also increased.
ZK is also gaining usage - contracts precompiled using ZK grew from 47 in 2020 to 680 this year.
When are Zero-Knowledge Proof (ZK) developers and users active?
Deployers of ZK Rollup contracts are active during Eastern Hemisphere business hours, as are ZK users.

ZK users and deployers appear to be concentrated in the Eastern Hemisphere, particularly in Eastern Europe, Africa, and Asia.

NFTs and DeFi are established use cases in crypto - most of the top smart contracts are related to NFTs or DeFi. How are these use cases developing? Let's start with NFTs.
NFT deployments grew more than 3x year-over-year across all major NFT active chains (Bitcoin, Ethereum, Polygon, Solana, Zora, Base).

NFT deployments reached an all-time high. 87% of new deployments occurred on Base and Zora.

NFT activity shifted significantly toward minting.
In 2024, NFT minting reached an all-time high, with 97% of minting occurring on Base.

Solana has 57% of minting wallets and captures 64% of minting transactions.

The increase in minting activity is because NFTs have expanded beyond the art field in 2024 to cover more application scenarios.

NFT trading remains an important base application and has expanded from OpenSea to platforms such as Magic Eden and Tensor.

NFT minting and trading volumes peaked in different regions - suggesting different user groups.


3,532 monthly active developers working on DeFi. DeFi developers are experienced - 2,097 (59%) have been working in DeFi for more than 2 years.


53% of DeFi developers work on Ethereum and its L2 chains.

DeFi’s Total Value Locked (TVL) grew 89% in 2024.

Ethereum’s TVL dominates, 7x that of the next largest chain.

Most TVL has been concentrated on Ethereum.

Non-Ethereum TVL grew from 3% to 36% in 3 years.

Non-Ethereum TVL grew from 3% to 36% in 3 years.

Non-Ethereum TVL grew from 3% to 36% in 3 years.
Non-Ethereum TVL grew from 3% to 36% in 3 years.
Non-Ethereum TVL grew from 3% to 36% in 3 years.
Non-Ethereum TVL grew from 3% to 36% in 3 years.
Non-Ethereum TVL grew from
The biggest jump in TVL share happened in Solana
What’s driving all this TVL growth? We can categorize DeFi developers by developer type.

Restaking grew by $29 billion in TVL over the past year.

LRTs grew to over 3.5M ETH.

46% of LRTs are used in DeFi.

Most LRTs are deposited into money markets, yield, interest rate derivatives, and bridging platforms.

Eigenlayer enabled the creation of LRTs as a space. So, how is Eigenlayer’s developer ecosystem developing?

There are 252 monthly active developers working in the Eigenlayer ecosystem. Eigenlayer’s developers are very engaged: 39% are full-time developers, and more than half of the developers have been working in the ecosystem for more than 2 years.


TVL is not the only metric we need to understand DeFi usage. While lending platforms have 3x the TVL of DEXs, DEXs have more unique addresses transacting. For example — DEX vs. lending platforms: In 2024, Uniswap had 72x more unique address interactions than AAVE. 

In 2024, DEX volume almost doubled to $209B per month.
Solana and Ethereum settled the most volume — over 2x the next largest chain.

Solana settled the most volume in 2024, at $574 billion. Total DEX volume for Ethereum mainnet and its L2 chains is $931 billion.

Solana dominates the low-fee DEX use case. In 2024, its volume more than tripled, reaching 646 million transactions per month.

81% of DEX transactions come from Solana.

By number of wallets transacting, excluding wallets with only 1 transaction and less than $1. Solana has the most unique wallets transacting, 7x the number of the next largest chain.

Base has the second most unique wallets transacting after Solana.

Base and Solana are very popular for small transfers. Wallets on these chains have the smallest average transaction amount.

Ethereum is most popular for high value transfers. Wallets on Ethereum have the largest average transaction amount.

Where are these DEX users? We can understand the usage of DeFi through DEX because financial activities often start or end from DEX.

Global activity is distributed differently across chains — the more evenly distributed the activity, the more global the usage. Ethereum and Solana have the most evenly distributed usage.

Stablecoins are one of the largest crypto use cases in the world. How are they performing? Stablecoin usage is at an all-time high: $196 billion in total stablecoins in circulation, with $81 billion in daily trading volume — both all-time highs for stablecoins.

USDC and USDT account for 95% of trading volume.

Ethereum is the first ecosystem for stablecoins - 59% of stablecoins are issued on Ethereum

What is the global activity of stablecoins?
Stablecoins are always active, but trading volume increases by 2-3% during business hours in Asia, Europe, and Africa.

Although stablecoin trading peaks during business hours in the Eastern Hemisphere, trading volume is more skewed towards the Western Hemisphere.

Bitcoin and Ethereum ETFs were launched this year, providing OTC capital with a convenient way to enter on-chain assets. Bitcoin ETFs have attracted over $50 billion in net inflows, making them one of the most successful ETFs in history.


Most of the volume for Bitcoin ETFs comes from retail investors.

Although Bitcoin ETFs are still in their early stages, institutional investors are buying spot Bitcoin ETFs at a record pace.

The Ethereum ETF was launched in July this year. Currently, the Ethereum ETF has $13 billion in assets under management (AUM) and has attracted $3.5 billion in net inflows. This performance is comparable to the most successful ETF launches since 2022 (excluding Bitcoin ETFs). This is also driven primarily by retail investors.

Bitcoin and Ethereum ETFs set a record. In their first year, the cumulative inflows are more than 2 times that of the most successful ETFs in history.

You may also like

Champion's Final Bow: FC Barcelona vs Real Betis – Celebrate the Title with a Home Finale

Best Oil Trading Platform for Crypto Users in 2026

5 Futures Trading Strategies Smart Traders Use to Cut Crypto Fees and Boost Futures Returns

What Is TradFi? How Crypto Traders Can Now Access Crude Oil, Gold, and Global Markets

How WEEX Bridges Crypto and Football: A Deep Look at the LALIGA Partnership Inside the WEEX App
WEEX is not just a LALIGA sponsor. It’s a true partner. From iPhone Dynamic Island to LALIGA-themed app icons and smart posters, see how WEEX brings football passion into every trade — and builds a real bridge between crypto and sports.

FC Barcelona vs Real Madrid Preview: El Clásico – Can Barça Clinch the Title at Spotify Camp Nou?
FC Barcelona vs Real Madrid El Clásico match preview for May 11, 2026. Barça need just 1 point to win LALIGA. Can Madrid delay the trophy? Full preview inside.

At the Stripe conference, I saw the future of the AI economy

Miners welcome a new life

Seven Important Judgments by Claude Code's Founder at the Sequoia Conference

The payment moment of AI agents: Who will become the Stripe of the machine economy?

Morning Report | MoonPay acquires Solana's execution layer DFlow; Strategy releases Q1 financial report; Manta Network announces the termination of Manta staking program

Rented Tracks: What is this wave of stablecoin FX hot money really paying for?

Dialogue Velocity Eric: What is the stablecoin track that the CFO really wants?

Strategy should have said that selling coins is not ruled out

How MegaETH Achieved a TVL of 700m Within a Week of TGE? Analyzing the Packaging Strategy

Futures Trading Hours: Trade Cryptocurrency 24/7 and Earn Back Up to 45% in Trading Fees
Learn futures trading hours and the best time to trade crypto futures. Discover 24/7 market insights, peak trading sessions, and how to earn back up to 45% in fees.
Why is a16z Crypto raising another $2.2 billion to heavily invest in Web3?
Polymarket Underlying Algorithm Explained
Champion's Final Bow: FC Barcelona vs Real Betis – Celebrate the Title with a Home Finale
Best Oil Trading Platform for Crypto Users in 2026
5 Futures Trading Strategies Smart Traders Use to Cut Crypto Fees and Boost Futures Returns
What Is TradFi? How Crypto Traders Can Now Access Crude Oil, Gold, and Global Markets
How WEEX Bridges Crypto and Football: A Deep Look at the LALIGA Partnership Inside the WEEX App
WEEX is not just a LALIGA sponsor. It’s a true partner. From iPhone Dynamic Island to LALIGA-themed app icons and smart posters, see how WEEX brings football passion into every trade — and builds a real bridge between crypto and sports.
FC Barcelona vs Real Madrid Preview: El Clásico – Can Barça Clinch the Title at Spotify Camp Nou?
FC Barcelona vs Real Madrid El Clásico match preview for May 11, 2026. Barça need just 1 point to win LALIGA. Can Madrid delay the trophy? Full preview inside.
